
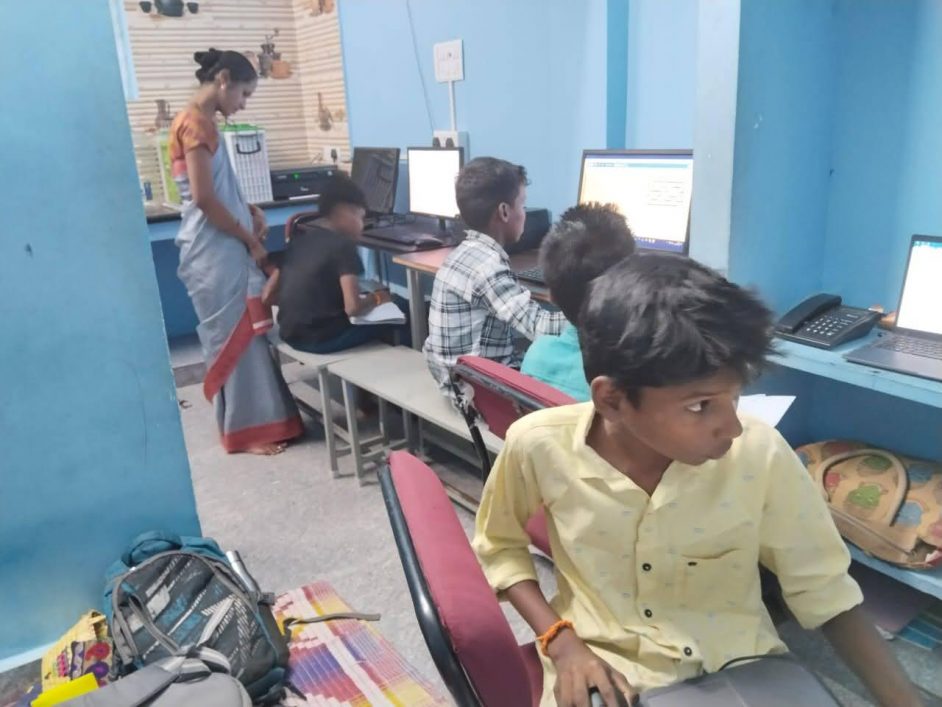
aining government teachers in 50 schools to teach a one-year curriculum under our ACE program. At our 7 RTCs, we teach 6 month courses to 6th to 12th std students in digital literacy, programming and more advanced topics.
Assessment Framework
We have also been working in parallel to develop a good assessment mechanism that tests the learning of the students and broadly the outcome of our efforts. There are four components in our assessments.
1. Project Work
As a part of the course work, all our students participate in a detailed project work. This occupies about one fourth of the total time for the course. For eg in our RTC courses, the instruction happens for about 3.5 months and the project work for about 1.5 months. For our primary and middle school program, classes 4 and above spend most of the third term doing project work.
The children learn a lot more doing project work than if they spent the time with more instructions. In addition to this, project work also gives a good mechanism for accessing the learning levels of the children.
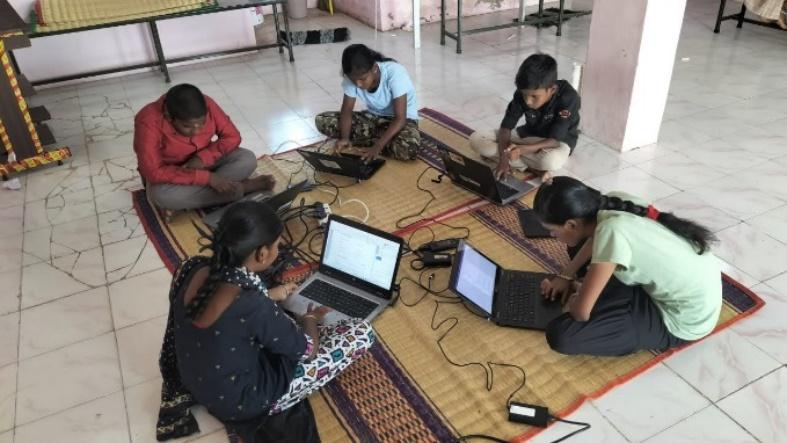
The children work in teams for their project work. Teamwork enables peer learning. However it makes assessment of an individual students learning difficult. We have been making efforts to reduce the team sizes. At the RTCs, we limited the team size to 3. The average team size for actual project submission is less than 2! At the primary and middle schools the team sizes are difficult to bring down because of the inadequate number of computers. Therefore we brought down the number to 4 only for 5th and 8th std students in the “certificate” schools. See the “Primary and Middle School Program” section below.
2. Asha Assessment
We conduct assessment aligned to the curriculum the students are learning for all classes from 4th upwards. These include pen and paper questions as well as questions that require them to do something on a computer like create a presentation or write a small program. Each individual student will need to work on a computer independently to take this assessment. We are once again able to do this at our RTCs but not at all the schools. We are doing these only at the “certificate” schools.
3. Standardised Assessment
Even though the Asha assessment described above are well aligned to our curriculum, this will not provide us any way to compare Asha’s CS programs against any other programs or against any standard out there. We were able to find a fairly standardised set of assessments for digital literacy with Northstar Digital Literacy Assessments. Administering this requires a lot of time as there are several different assessments that test different aspects of digital literacy. Therefore we plan to do this as a sample survey administering it to some number of newly joining students as well as some number of completing students.
4. Teachers’ Inputs
Through regular interaction with the students, teachers develop an understanding of the capabilities of a student which do not often get captured by objective measures. We consider this as well as parameters like attendance in awarding certificates to the students who complete our courses.
Assessments at RTCs
RTC terms run from Feb to Aug and Aug to Feb. At the RTCs for the last several terms we have been conducting project work as well as the end of term assessment that is aligned to the curriculum. The term that ended in Feb 24 saw these as well. In addition we for the first time did base and end line assessment with Northstar Digital Literacy Assessment, a standardised assessment. These are described below.
Asha Assessments

The Asha assessments were conducted for all the various courses taught at the RTCs. Here are the average scores and the standard deviation for the different courses.
Course Name | Students strength | Number of projects | Maximum Marks | Average Marks | Standard Deviation |
| Digital literacy | 245 | 120 | 30 | 19.58 | 6.48 |
| Basic programming | 109 | 49 | 40 | 23.87 | 9.08 |
| Web devlopment | 23 | 15 | 50 | 35.33 | 11.38 |
| Animation | 22 | 11 | 50 | 38.59 | 8.84 |
| Physical computing | 12 | 8 | 50 | 37.67 | 4.25 |
Students took the test well and their marks reflected their good understanding of the topics. One of the observations that was made during the Asha Assessments conducted at the RTCs was that it is being conducted a little informally. As many of the students are unused to a formal assessment that truly tests their learning, even in their school, conducting one with the questions in English and having to answer on a computer is highly unfamiliar to the students. The more senior students who have sat for the Asha assessment in the past handle this alright. Junior students sitting for their first or second assessment keep asking the teacher what the question means. We should probably have a practice test or two before the actual test.
Project Work
As stated earlier, we were aiming for 3 students per team and the students did a lot better than that. There were a total of 411 students who completed their course across all the 6 RTCs that were active in that term. Between them they submitted a total of 203 projects which brings the average team size to just about 2! We found the quality of the projects also to be good across all the courses. The amount of work spent by the teams on their projects was clearly substantial.
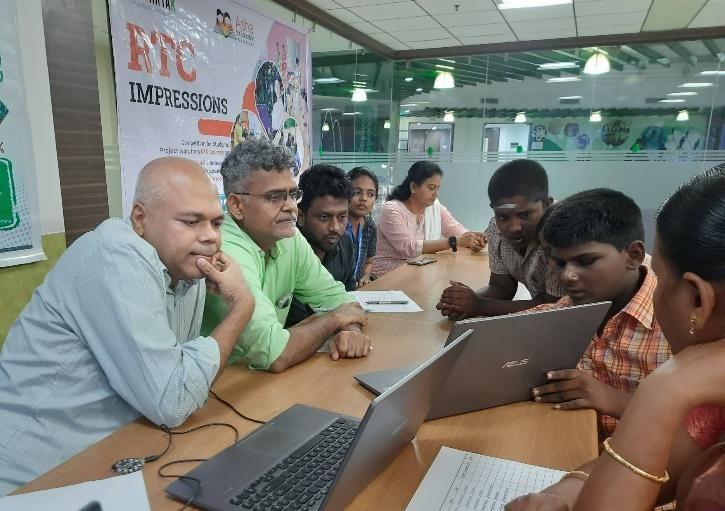
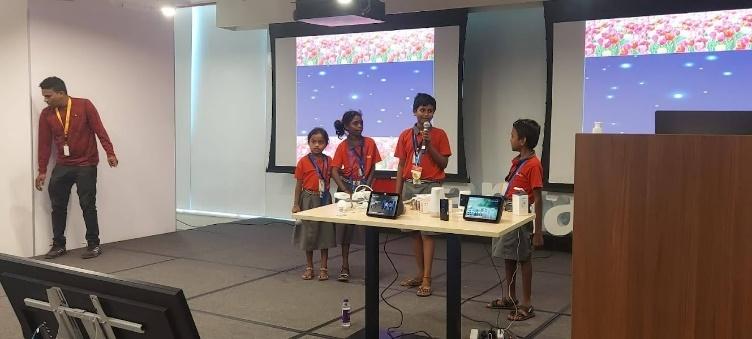
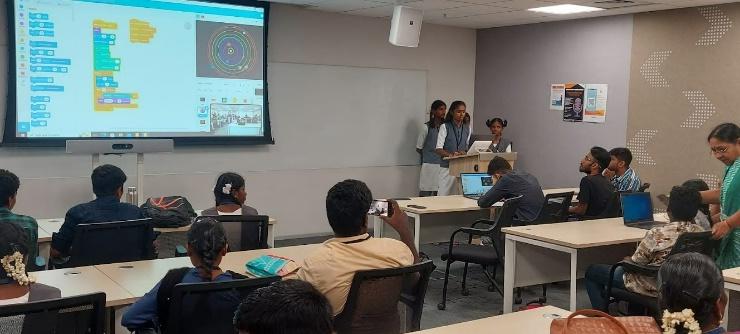
Here is a report on the RTC Impressions conducted on Feb 7th that also talks about the projects that were submitted.
Standardised Assessment
At the RTCs we conducted the NorthStar assessment for the first time. We conducted it on a random selection of students who completed the digital literacy course in Feb 24. We also conducted it on a random collection of students who had newly registered for the digital literacy course for the Feb to Aug 2024 term. These are the End Line and Base Line results that are shown below. Note the sample size is given in the bracket.
Type of Assmt | BaseLine | End Line | End Line Range | Notes | |||||
Total | With some CS | With no CS | |||||||
| Basic Computer Skills – Launching/closing app. Drag and drop. | 35% (9) | 43.6% (5) | 25% (4) | 83.16% (10) | 72.9% to 96.3% | Baseline was also high because of students’ familiarity with mobile devices. | |||
| Internet Basics – Browser and browsing. URL, searching, typical parts of a website etc. | 21% (7) | 23% (3) | 20% (4) | 63.5% (7) | 40.7% to 89.2% | Children struggled to identify typical things in a website like what would lead to the home page, what is an ad in the page. That shows lack of regular browsing. | |||
| Using Email – Sending, receiving, forwarding emails with cc/bcc, attachments etc. | 13% (8) | 25.3% (3) | 7% (5) | 57.3% (13) | 39.5% to 79% | Challenges related to spams, security various standard folders etc. | |||
| Windows – Login / logout, search file files/apps, Windows help etc. | 27% (6) | 32% (3) | 22%(3) | 62.5% (9) | 45.1% to 79% | Sometimes the terminology children were used to did not match the questions. Also, they are not used to using notifications, windows help etc. Unfamiliarity with Microsoft office tools was also a problem. | |||
| Microsoft Word – Various features of Word. | 20% (5) | 22.4% (1) | 19.6% (4) | 63.2% (5) | 40.6% to 72.6% | Some problems because they are taught OpenOffice. They were also not familiar with page orientation, spacing between lines, adjusting margins etc. | |||
| Microsoft Excel – Various features of Microsoft Excel. | 8.4% (11) | 12.1% (3) | 7% (8) | 68.7% (13) | 42% to 88.2% | Some problems because they are taught OpenOffice. Students had problems with features like sorting, freezing of rows and columns and formulae. | |||
| Microsoft Powerpoint – Various features of Powerpoint. | 5% (6) | 3.9 % (1) | 5% (5) | 70% (14) | 51% to 86.4% | Some problems because they are taught OpenOffice. Unfamiliarity with terms like ribbon, themes etc. | |||
| Google Docs – Various features of Google Docs text document. | 23% (6) | 28.8% (3) | 16% (3) | 55.3% (16) | 31.4% to 83.3% | Some problems because they are taught OpenOffice. They were also not familiar with things like margins. | |||
As you can note the scores for the Endline students had improved between 30% and 50% over the Baseline students for all the content areas. The average scores for the Endline students is above the 50% cutoff on all the subjects. This shows the significant learning across all these areas of digital literacy from taking our one term Digital Literacy course.
Some broad points to be noted about these assessments are,
- Some of the BaseLine students had some exposure to computer science. These are typically students from Asha primary schools or from schools where Asha teachers have been going to conduct the Explore program. As you can note, typically, these students did better than students with no computer exposure.
- In our digital literacy curriculum, we teach using OpenOffice. NorthStar assessment is based on Microsoft Office. Most our students (end line) got some of the questions wrong because of this.
- We designed out curriculum completely independent of the NorthStar assessment. However, having done these assessments once, we may include a few things in our curriculum as well like,
- Document orientation, margins, sorting/freezing in spreadsheets etc.
- Some more emphasis on security.
- Emphasise some terms like ribbons, margins etc.
This would impact the Endline scores a bit in the subsequent terms.
- In most cases the teachers needed to explain the questions in Tamil as they couldn’t understand the English question. But care was taken to not accidentally reveal the answer. Lack of English knowledge is a big problem with digital literacy as a whole.
- If the students click somewhere else on the screen, it moved to the next question. They weren’t sure how to go back to the previous question. This also indicates a lack of familiarity with using computers. This was especially so with the Baseline students.
You can see detailed comments from our teachers on the kind of questions in the assessments and some of the questions our children had challenges with here.
Assessments at Primary and Middle Schools
Our assessments at primary and middle schools have been improved significantly this year. Both the project work and the assessments have seen changes as explained below. Both of these need further improvements as well. We are yet to start standardised assessments at the primary and middle schools. We hope to start those next year.
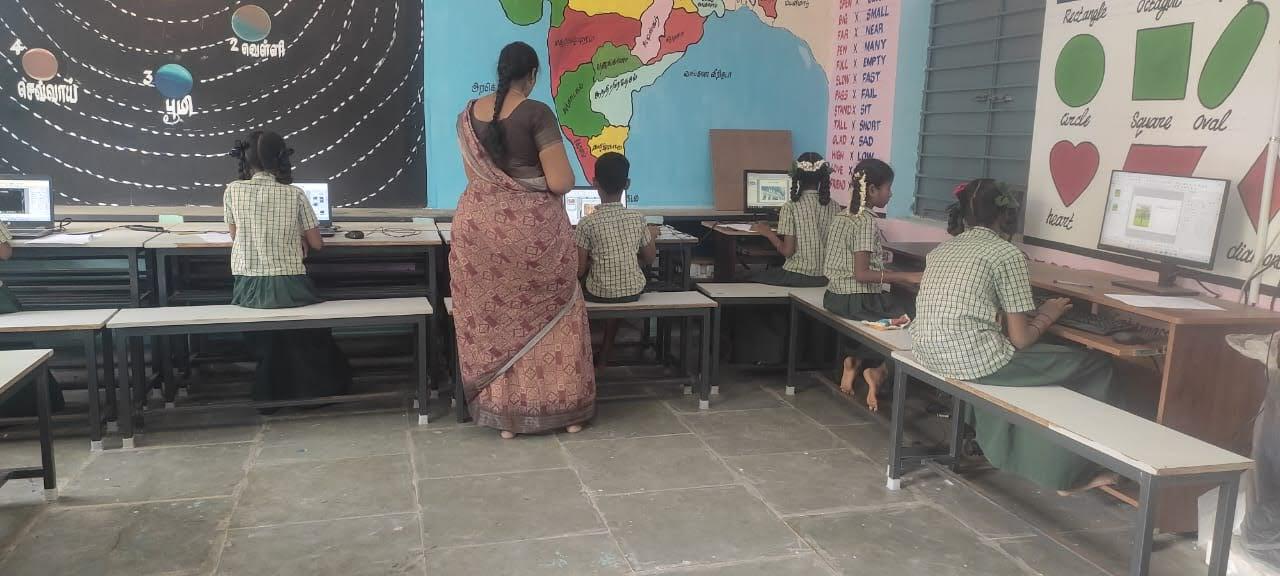
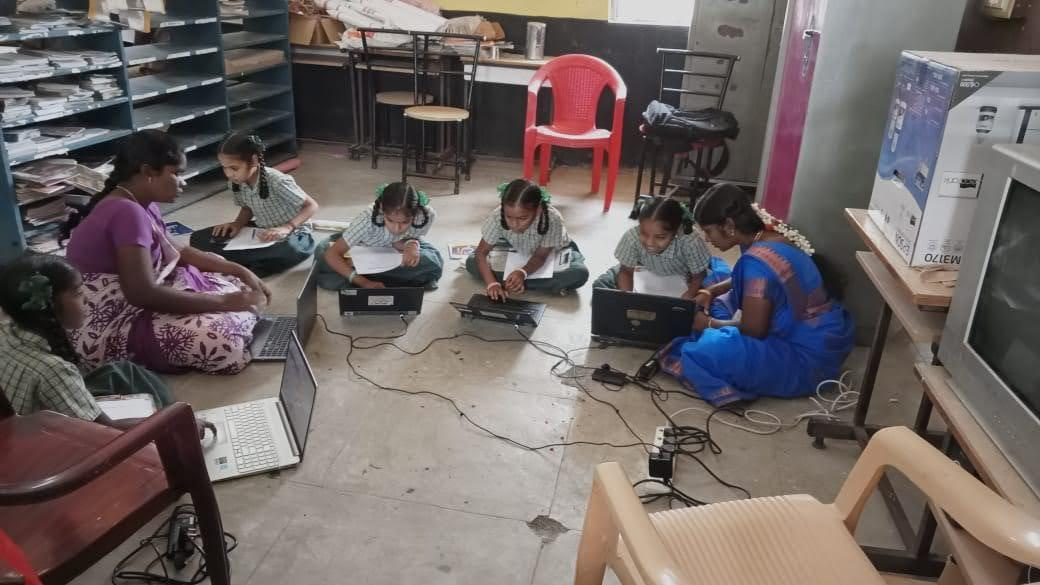
We are teaching computer science at 180+ primary and middle schools – 165+ in TN and 15 in UP. There are very few government-provided computers in these schools. Therefore, the only computers present in these schools are computers that we have been able to obtain from donors and donate to these schools. Our computer science instruction is constrained by the lack of computers. This lack of infrastructure is especially telling when it comes to project work and assessments. Project work is done by teams of students in 4th/5th std and in 7th/8th std. We would ideally like to restrict the team size to 3 or 4. However if a class has 25 children and the school has only 3 computers, a team size of less than 8 will not be possible. Similarly conducting assessments will require each individual student to work by themselves independently on a computer. In such a school that would mean that we can only conduct assessment for 3 students at a time. Given that the assessment takes about an hour, this means the assessment just for that one class will take more than a day.
Another problem is that many of the schools among this 180 have been added over the last couple of years. At these schools we are still in a catch-up mode. 5th std students may still not be taught the 5th std curriculum and so on. This is especially a problem with 7th anf 8th std students. We start them with the digital literacy lessons taught to younger classes (i.e. OpenOffice, Windows, Using Internet etc.) before going properly into programming. This also means we cannot conduct the usual assessments with them unless they have had at least 3 years of continuous instructions with us.
Given these constraints, we decided to identify a subset of schools where there are adequate number of computers and where the curriculum is also caught-up and the students are being taught at the correct level. In these schools we decided we will conduct projects and assessments the way they should be conducted. The children in 5th and 8th std will receive certificates marking completion of their digital literacy and programming courses respectively. We named these schools “Certificate” schools. In April 2024, 42 of our schools spread across various projects were designated as Certificate schools. The hope would be eventually move all our schools to certificate schools.
The number of projects submitted are shown below.
- Certificate Schools:
5th std strength – 527
4th and 5th std strength – 1050
No of Presentations submitted – 241 - Non Certificate Schools:
5th std strength — 1804
4th and 5th std strength — 3377
No of Presentation Submitted – 505
We mandated that the team sizes for 5th std should be 4. Even including the 4th std, the average team size per submission at Certificate schools was 4.36. At non-certificate schools that ratio was as high as 6.69. Note for the non-certificate school we included only our projects Sangamam, Thulasi and Pearl which were more mature in terms of curriculum implementation. Here is the data for programming projects.
- Certificate Schools:
8th std strength – 173
7th and 8th std strength – 351
No of Programs submitted – 82 - Non Certificate Schools:
8th std strength — 404
7th and 8th std strength — 845
No of Programs Submitted – 136
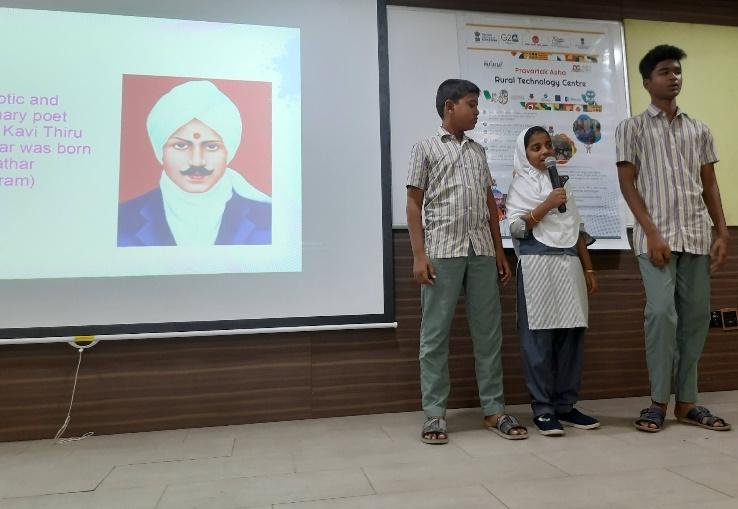
We are working on a separate report on Asha Impressions that will provide more details about the best projects among these. However, looking at the quality of the average projects, the presentation projects submitted by the 4th and 5th std children were of a good quality. When I visited these schools before the project submissions or between the project submission and Asha Impressions, I could also see that most of the children indeed knew how various aspects of the presentations like slide transition, inserting audio etc. worked.
However, both the quality of the projects submitted as well as my personal observations were not so positive regarding the programming part of the curriculum. Most of the programming projects were barely the kind of programs which they should be doing as part of class exercise while learning various concepts like looks, sensing, pen operations etc. Many of them did not demonstrate a technical mastery and even those that did, did not go much beyond that to build that into a project.
Even during my personal visits, I could notice that when I gave a challenge to the children (kind of programs which are in our assessment), many of them didn’t know where to start. Even the teachers did not seem 100% confident.
Asha Assessment
We conducted formal assessments at the 42 Certificate schools of which 13 were middle schools and 29 were primary schools. We conducted exams for about 500 5th std students and for about 180 8th std students at these schools. An external invigilator (computer teacher who goes to other schools) conducted these tests. The children wrote the tests individually working on their own computers.
The assessments also confirmed what we noticed in the project work. Here are the average marks for the students in the various questions in 5th std.
| QNo | Question | MaxMarks | Average Marks |
| 1 | Fill in the blanks question about files/Window operations etc. | 5 | 3.11 |
| 2 | Match the following question on editing ops, | 5 | 2.99 |
| 3 | MCQ question on hardware and OS | 5 | 3.1 |
| 4 | Create a presentation with 5 slides | 10 | 6.63 |
The 5th standard student did uniformly well in all the questions and in particular they did well in the presentation question. Here are the average marks for 8th std students.
| QNo | Question | MaxMarks | Average Marks |
| 1 | Short answer question on Digital Literacy. | 5 | 2.63 |
| 2 | Create a text document with photo and text downloaded from Google search. | 5 | 2.95 |
| 3 | Unplugged activity on programming like maze game or paper cup game. | 5 | 2.03 |
| 4 | Scratch program with multiple sprites | 10 | 4.64 |
While the students did OK in the questions on digital literacy, they did not do well in the programming related questions – both the unplugged activity and the Scratch program. In personal observations, we could see many students in 8th std struggling with the programming question without much idea as to how to do it. Even the 46% marks they have got on an average for basic things like adding the necessary sprites and background. Very few students, got the logical programming part correct.
Our Learnings
Our rigorous assessments and emphasis on project work has revealed several things about our own programs. By and large our RTC program, which has been going through these rigorous assessments and projects for 3 terms now, is doing well. The learning levels of the children as reflected in their assessment performance, quality of the projects submitted as well as their performance in the Northstar standardised assessments, is alright. There are some minor additions to the curriculum that can be done to our digital literacy curricula which we will be incorporating.
Our school program for the primary school children is also doing quite well and the children seem to be performing at an adequate level. However, there are deficiencies in our teaching of programming to the middle school students.
In discussion with the teachers, we found several reasons for this. Here are some reasons we do not have too much control over,
- This was one of the Corona affected batches. In particular they did not learn Computer Science during their 4th and 5th stds. That meant that basic computer usage itself was taught to them only after they returned from Corona and this meant they did not receive much programming instructions.
- Many schools do not provide the 8th std as much time with our Computer teachers as other classes. As this is the final class before they move on to the High/Higher Sec schools, the other subject teachers focus more on them.
- Poor infrastructure. Insufficient number of computers affect all schools. Even the Certificate schools have barely enough computers and does not give sufficient time for students on computers.
We also found factors which we can do something about.
- With the limited number of computers, the classwork is also mostly done in teams. During the assessment, it became clear that there are weak students who haven’t learnt much. Teachers need to do more to ensure all the team members participate.
- Teachers’ own understanding and comfort with Scratch and programming was not up to mark. We have to continue focussing on teacher training as we have been doing.
In addition to these, we felt some of the rigour that we have been bringing to the ACE program in terms of the structure of the curriculum and the reporting expected from the teachers can be brought to our primary and middle school computer teachers as well.