
Asha Chennai conducted an assessment in Oct 2022 at our mini-schools before they closed and then a combined written and oral assessment in April 2022 at the schools we support. This reveals the extent of the damage wreaked on education due to the Covid closures and evaluates the mini-schools run by Asha Chennai in being able to push back the damage.
Here is a very delayed analysis of the oral and written assessments held in 2021-22. Oral assessments were held in our mini-schools in Oct 2021. Then, combined oral and written assessments were held at all our supported schools in April 2022. The written assessments are not comparable with other written assessments because the questions vary in complexity. They are intended more for gap analysis. Further the written papers for April 2022 were made easier than those in previous years. For these reasons, you wouldn’t find a lot of analysis using the written assessment scores in this document. The analysis is mostly based on the oral assessment scores.
Capabilities of Data and Software
Asha Chennai has been conducting assessments at all supported schools from 2015-16 onwards. We conduct Oral assessments based on Pratham’s ASER in November and a written assessment in Feb/March timeframe. As noted earlier, the year 2021-22 was different.
Over time we have also started collecting lots of sociological data related to the students. We also collate the data available about the school from the UDISE database and use that also towards our analysis. The data available at the school level includes,
Strength of the school and strength in each class.
Strength of the school over the last few years which tells us whether the strength was increasing or decreasing.
Number of teachers in the school.
Percentage of children who are below poverty line.
The caste/religion mix of the students.
For individual students, we have been collecting the following data:
Education level of the parents.
The pre-school education of the student if any.
Height, weight and data-of-birth of the student.
Attendance of the student in the months leading up to the assessment.
Any medical condition.
Does the student have breakfast before coming to school?
Is the student regular with homework?
How far from the school does the student live?
During the Corona break we were running the mini-schools. At the mini-school, we collected the following additional data about the students,
The school from which the student comes and the type of the school (private, govt, aided etc.).
The number of months for which the student has been attending the mini-school.
For the school assessment conducted in 2021-22, we also collected details about how many months of mini-school did the student attend.
The software that we have built for analyzing the data has the following components,
MySQL DB for storing the student details and assessment results. Even the detailed answers of the student for every question.
Perl scripts for processing excel files with student details, school details and the detailed written assessment grading for the student and entering these into the DB. These are manually validated these days through SQL queries etc. For eg. Date-of-birth for a student last year should match the one for this year.
Various displays of this data for analysis including the following.
Display of average written scores by subject-class for each school. Further, marking it as red, white or green depending on whether the school average is less than all-schools average minus std deviation or around the average or greater than all-schools average plus std deviation.
Compare the number of children in various oral assessment status buckets between two samples which can be a school, a school group, or a cross-section of students across schools based on one of the school-student sociological criteria mentioned above.
Compare an average oral assessment score and average written assessment score for each subject across all classes between two samples.
List the schools by average oral and written scores for each subject.
Correlate the average oral and written scores of the schools against the various factors for the school like strength, teacher-student ratio, RTE score etc.
The following analyses used the above tools.
Loss of Education due to Corona
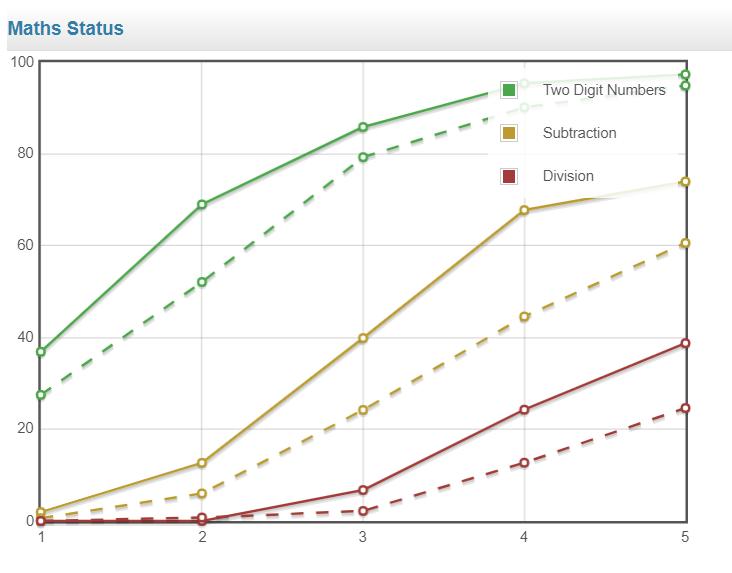
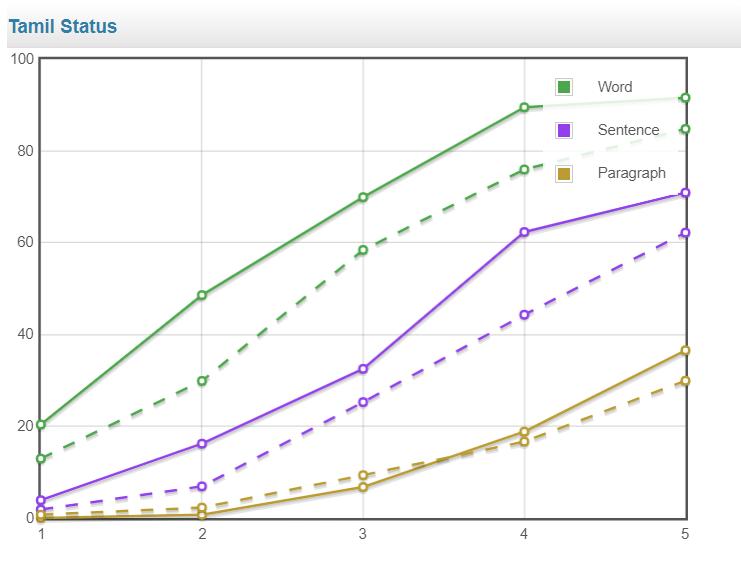
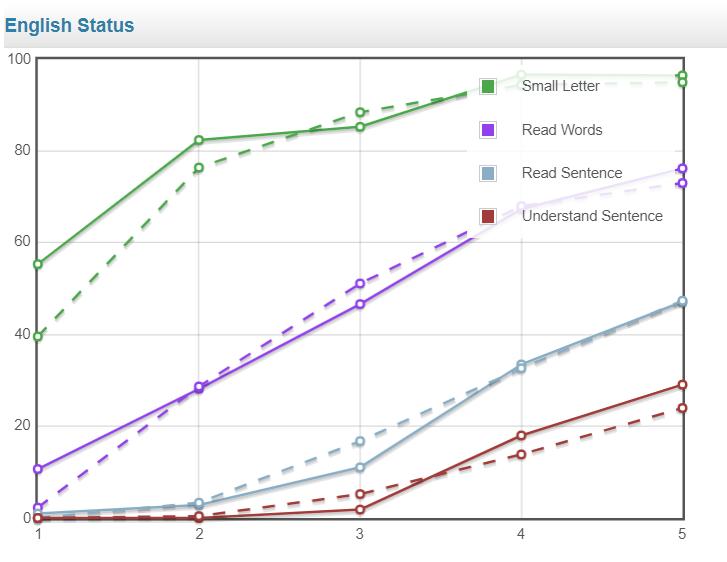
One of the main reasons for conducting the assessments this year was to get some concrete data on the loss of education due to Corona. We knew this was a weird year to conduct an assessment. The children had missed more than 18 months of school and had just had about 6 months of school and even that was not continuous (Nov to April with a month break in Jan). They were being taught a reduced curriculum. We wanted to see by how much the education of the children has suffered due to Corona.
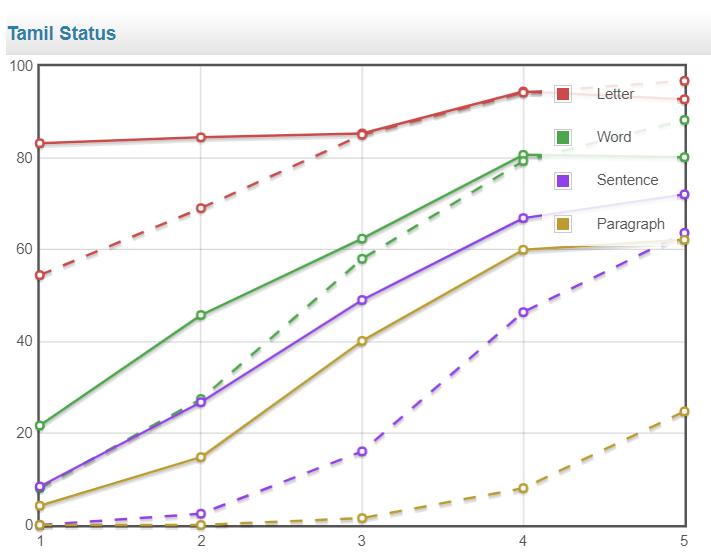
Here are graphs that compare the performance of the children in oral assessments in 2021-22 vs 2019-20. The normal lines are for 2021-22 and the dashed lines are for 2019-20. The points show the percent of children in the class (X-axis) who possess that skill level.
Further the subjective feedback from the teachers conducting and grading the assessments was that the performance in written assessment was even worse when compared to previous years than in oral assessment. Usually teachers will need to walk children in class 2 through the written assessment as they wouldn’t have a clear idea what to even do with the paper. This year, they needed to walk even class 4 and class 5 children through the paper. The children were completely unused to writing answers to a question paper!
Mini-Schools’ Impact on the Performance of the students
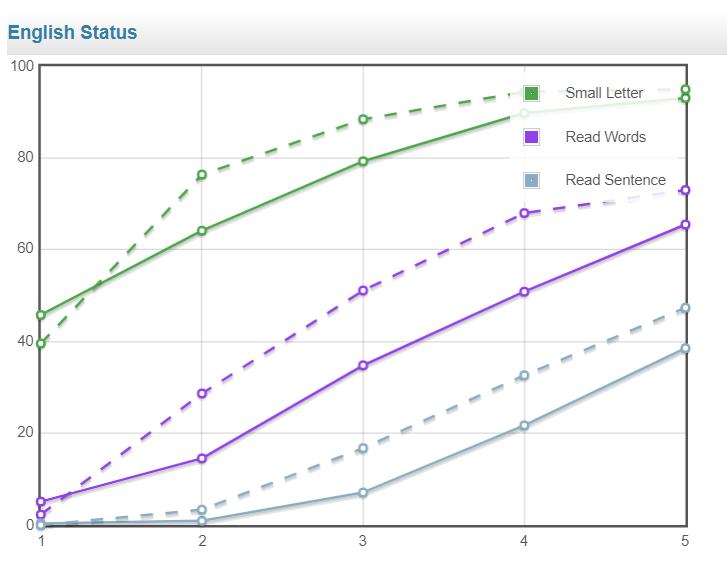
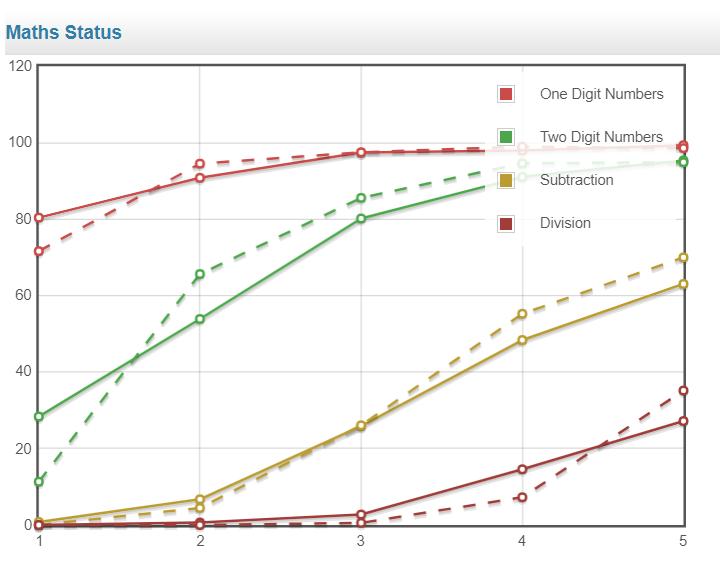
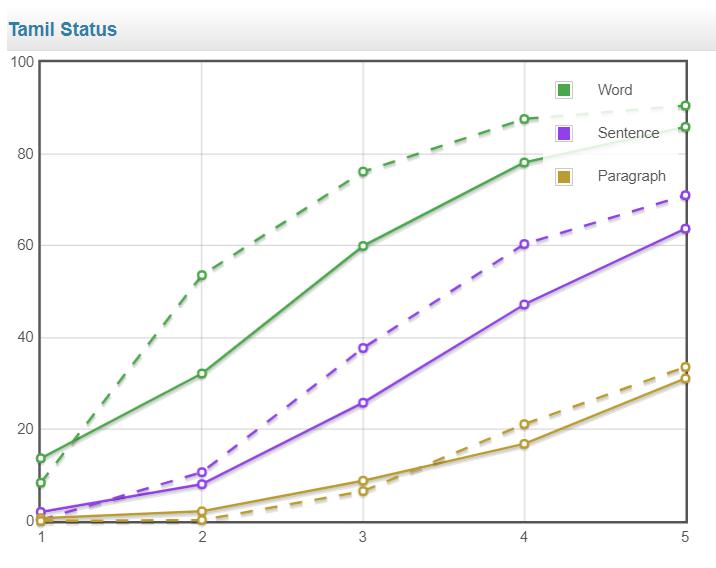
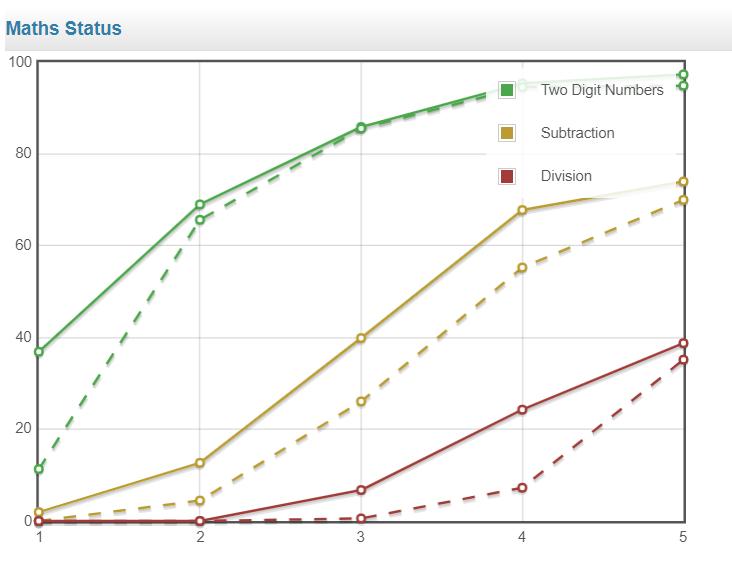
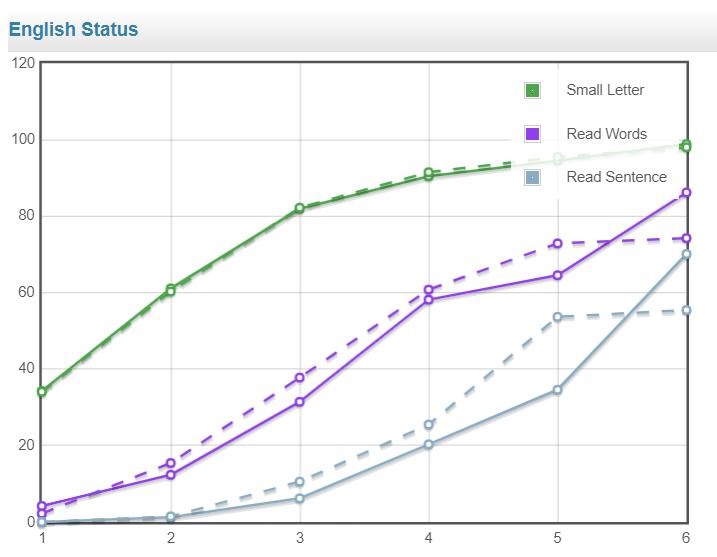
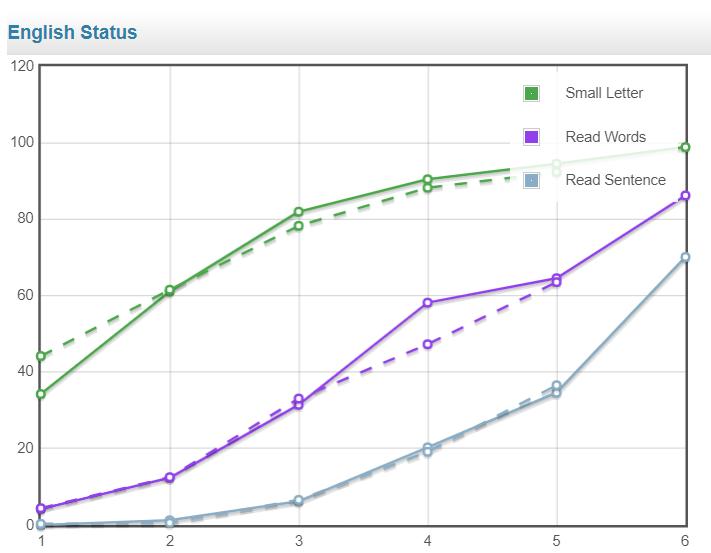
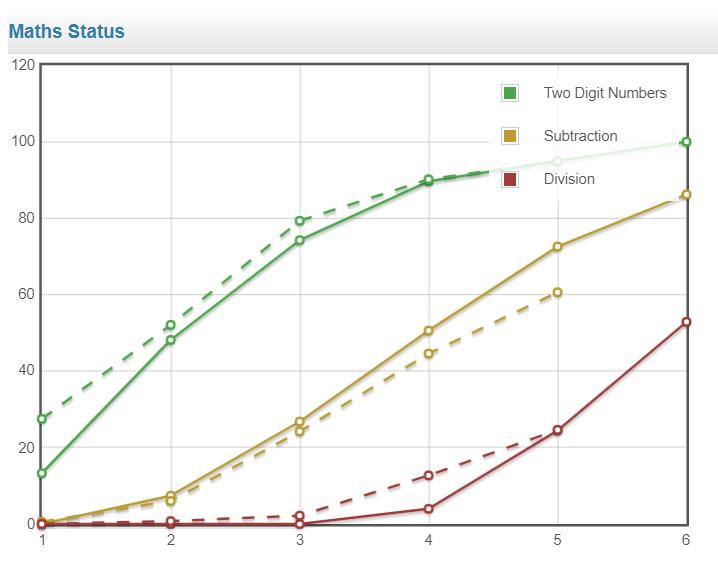
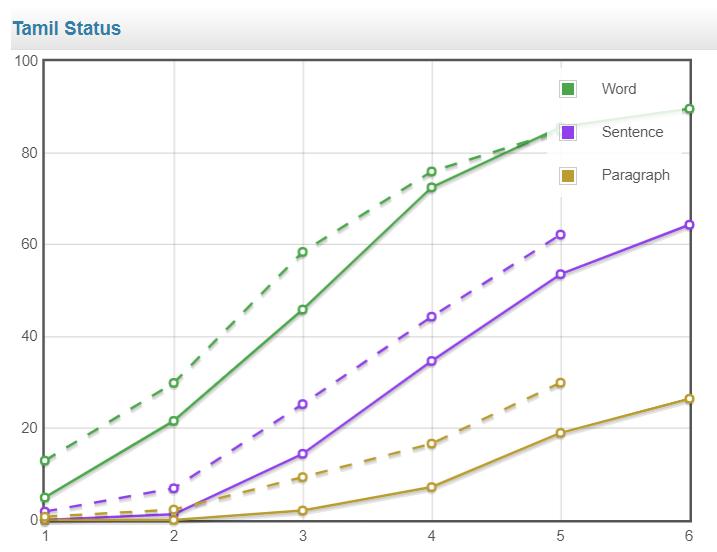
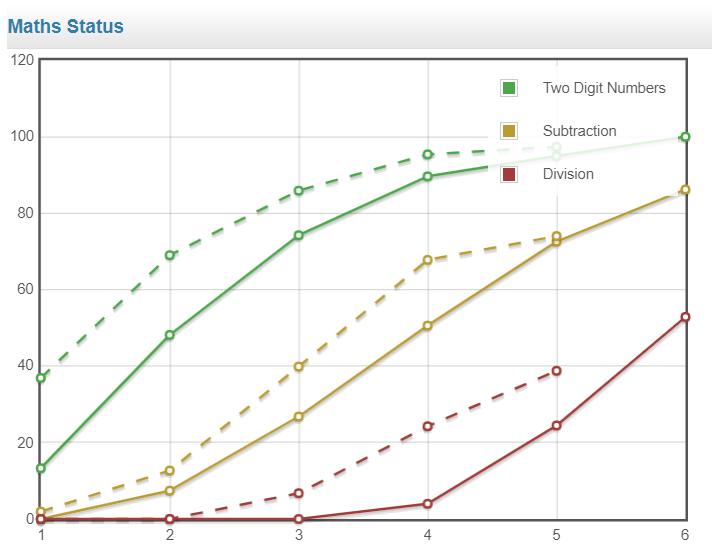
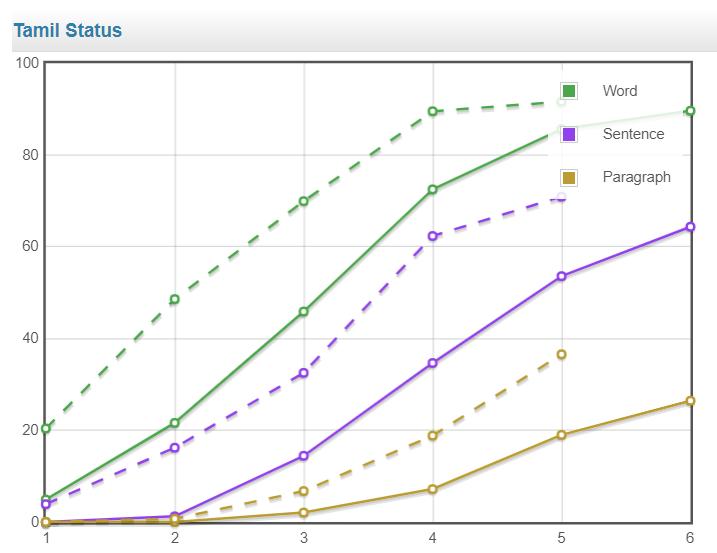
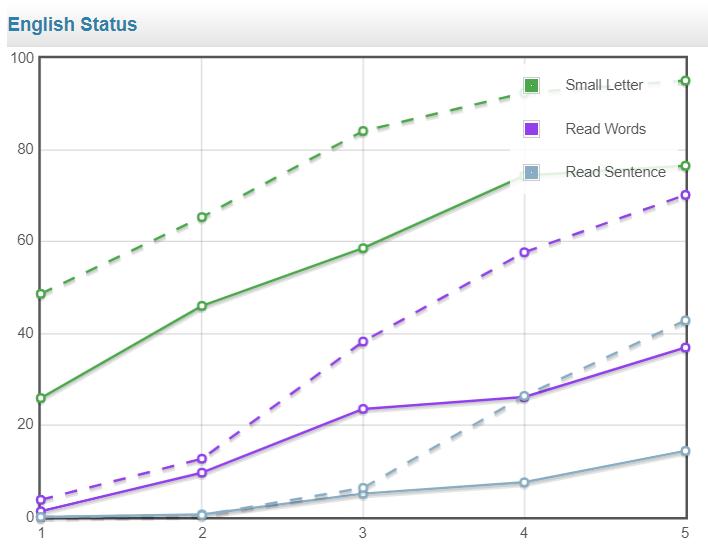
Many of the schools where we conducted the assessment in April 2022 are in villages where we ran our mini-schools. Of the total of 8082 students for whom we conducted the assessments, 1084 students attended our mini-schools for 3 months or more. We compared the performance of these 1084 students with the rest of them. Here I am showing their oral assessment performance in English, Maths and Tamil. The normal lines represent the children who attended mini-schools and dashed lines represent children who did not.
As you can see at every level and in every class, the children who attended our mini-schools have significantly outperformed those who haven’t.
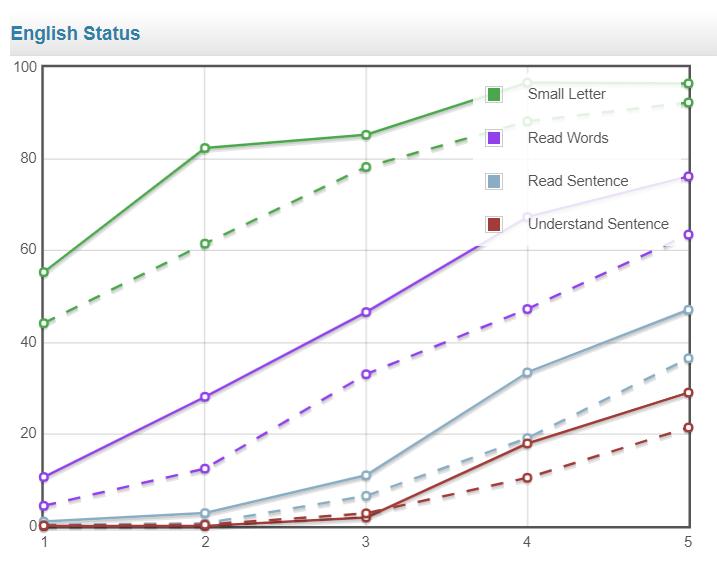
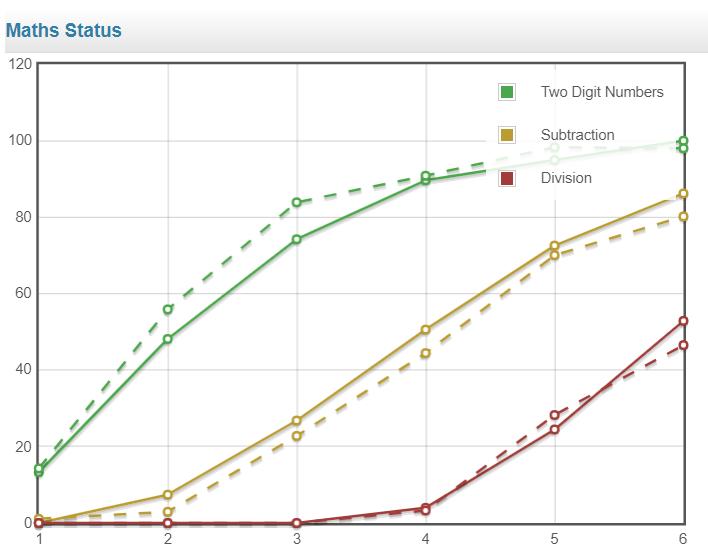
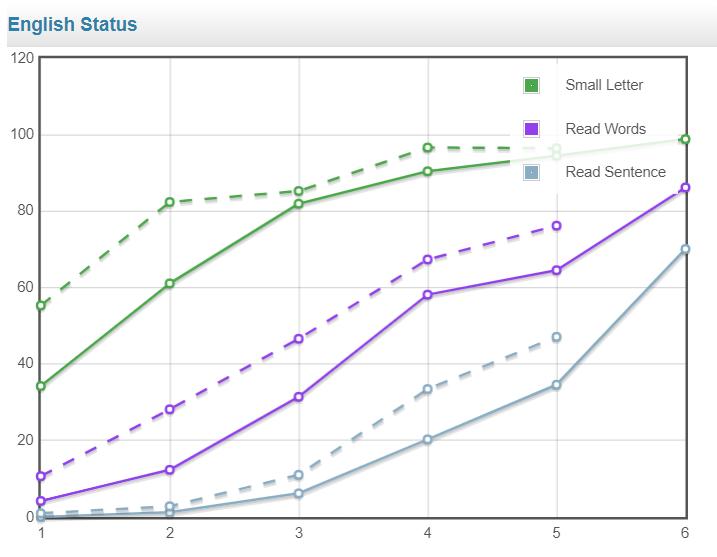
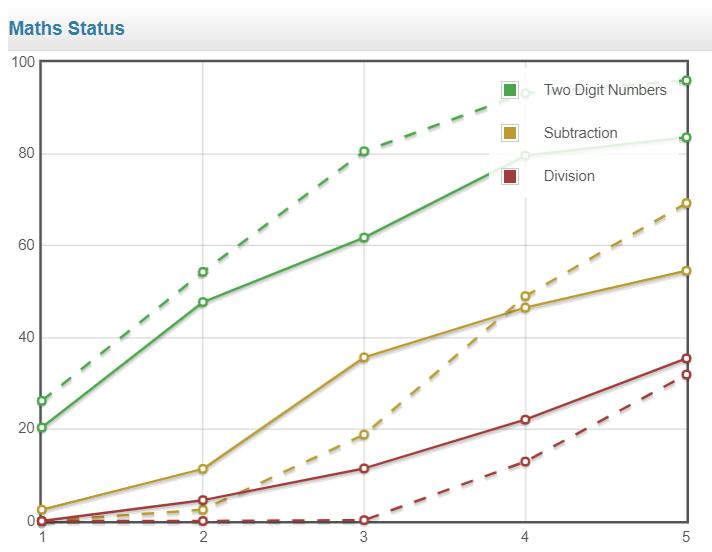
We then compared the performance of these children who attended our mini-schools against the average performance of all students in 2019-20, the last year when assessments were conducted at the regular schools. Here are the results. Note the regular line represents children who have been in our mini-schools in the April 2022 assessment and the dashed line the children in the regular schools in Nov 2019.
How were Mini-schools doing prior to reopening?
As mentioned earlier, we had an assessment in October in our mini-schools just before the schools reopened on Nov 1st. Here is a comparison of the performance of the children in our mini-schools in Oct 2021 and in Oct 2020. The regular lines show the performance in Oct 2021 and the dashed lines, the performance in Oct 2020.
As you can see the performance in Oct 2021 is a little worse than the performance in Oct 2020. There may be multiple reasons for this drop in performance including,
As Corona receded, we started conducting our mini-schools in more remote villages where the performance may have been worse.
There were many more mini-schools and students in 2021 (1342) than in 2020 (860). Therefore many of the students in 2021 wouldn’t have also had a break in education due to Corona. This would have been less in 2020 as the Corona break was only 5 or 6 months in Oct 2020 vs a full 18 months by Oct 2021.
Our own model of giving education for just 3 hours was also testing its limits. Our teachers were themselves feeling that the children do need the structure provided by regular schools and that we weren’t providing sufficient writing work etc.
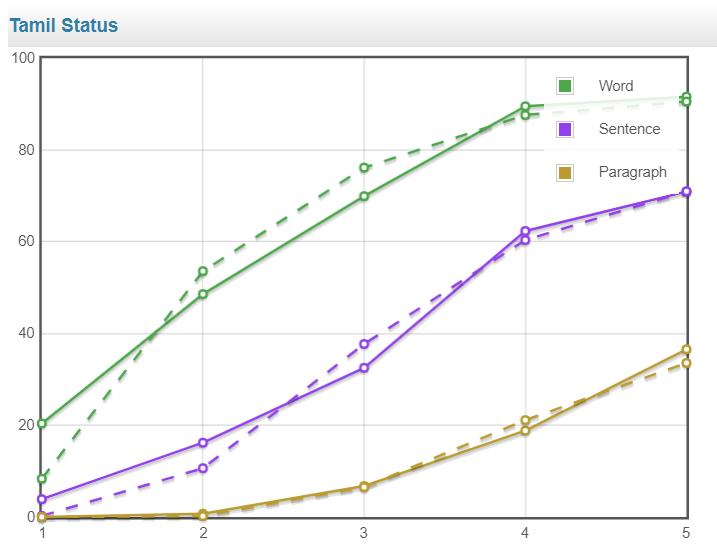
Here is another comparison, this time of the children in our mini-schools in Oct 2021 vs the children in the schools in Apr 2022 who did not go to our mini-schools. The regular lines represent children in our mini-schools in Oct 2021. The dashed lines represent children who did not go to our mini-schools in April 2022.
As you can see the children in our mini-schools were already at pretty much the same level as the other children reached by the end of the truncated academic year in Maths and English.
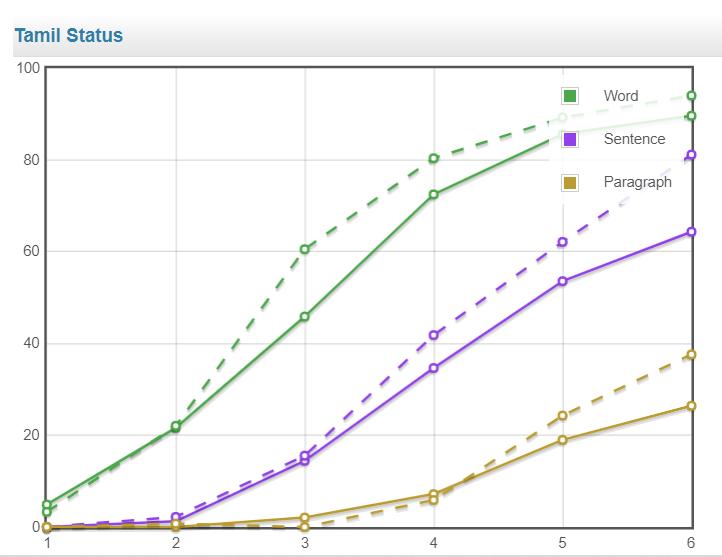
While we cannot be 100% sure, I believe while the mini-schools did very well to arrest the slide in education and kept the children more or less at their class level, the same model couldn’t have continued indefinitely. Even the children in the mini-schools benefitted by the transition back to the regular schools. That is reflected here in the comparision between the students in our mini-schools in Oct 2021 vs the mini-school children in the regular schools in April 2022. The regular lines represent children in our mini-schools in Oct 2021. The dashed lines represent children who had been to our mini-schools in April 2022.
As you can see the children in our mini-schools were already at pretty much the same level as the other children reached by the end of the truncated academic year in Maths and English.
While we cannot be 100% sure, I believe while the mini-schools did very well to arrest the slide in education and kept the children more or less at their class level, the same model couldn’t have continued indefinitely. Even the children in the mini-schools benefitted by the transition back to the regular schools. That is reflected here in the comparision between the students in our mini-schools in Oct 2021 vs the mini-school children in the regular schools in April 2022. The regular lines represent children in our mini-schools in Oct 2021. The dashed lines represent children who had been to our mini-schools in April 2022.
As you can see the children have achieved tremendous progress after coming back to the regular schools. This greater than usual jump in their learning might be due to their benefitting from the alternate approaches of mini-schools as well as now the usual approaches of the regular schools.
Children in UP and TN
Another interesting opportunity we had in April 2022 was to compare the children in the schools we support in TN with the children in the schools we support in UP. Here, the regular line represents UP and the dashed lines TN.
Before analyzing the results, I would like to caveat that this is the first year when we are conducting the assessments in UP. The teachers may not have been as rigorous in following the processes as we do not Tamilnadu. But that said the difference is really stark. In English, the students in TN are performing far better. In Maths, there are differences in both ways and the students are performing at about the same level overall. However in Tamil/Hindi, the children in UP are doing far better in Hindi than the children in TN are doing in Tamil. This seems to be consistent with other findings (ASER, NAS etc.) about the performance of children from Tamilnadu in ability to read and write in their language.
Further Work and Conclusions
The assessments continue to provide a good tool to monitor where we are heading with our work and measure the effectiveness of our interventions. While mini-schools have ended, some of the extensions we have made to the software to enable meaningful analysis for the mini-schools will remain useful even for regular schools.
Some extensions and improvements we are working on for the coming years are,
Equip ourselves for scale by making it possible for teachers to submit the student details and the written assessment grading online. This will significantly reduce the manual work required in validating the data as well as manual work required in tracking the status of submissions for each school. It will also eliminate human error in some of the processing. For eg. by mistake taking the data from an old Email instead of the latest one.
One of the biggest gap in out DB was that there is no single student ID which tracks a student across the years. We are adding that retrospectively and will maintain it consistently going forward. This will enable us to study the change in learning instead of just the level of the student at a certain point in time.
We still aren’t performing correlation of the performance of the students against the data we have gathered at a student level like height, weight, age etc. We need to do that and find meaningful ways of presenting the data visually.
We are not doing any linear regression to study the impact of various sociological factors in combination towards explaining the performance of the students. We will start doing this. This will move us from just descriptive analytics to predictive and prescriptive analytics.